SOFTWARE


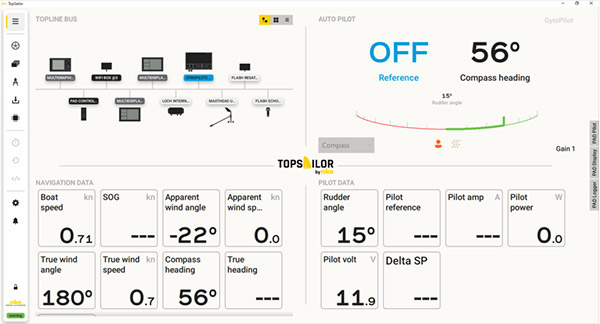
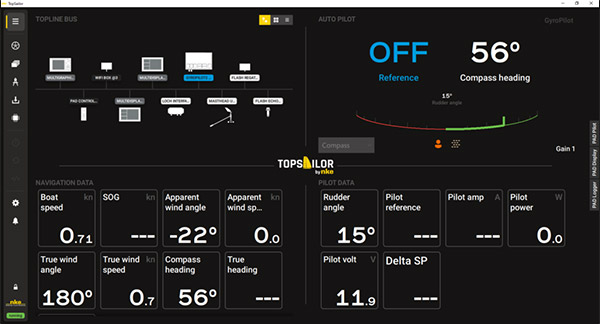
Visualize your nke installation
The dashboard allows you to see at a glance your instruments, autopilot status and the situation you’re in.
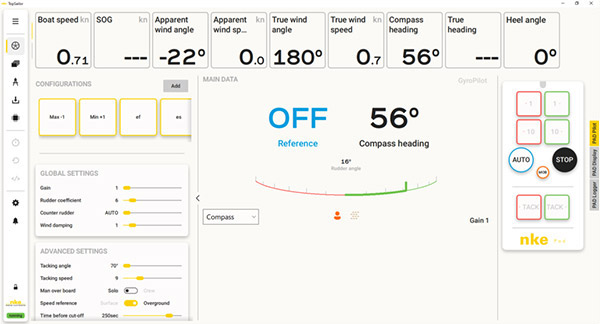
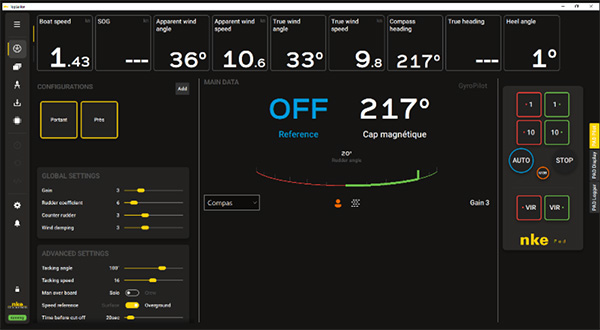
Configure your autopilot
Take full control of your autopilot. Run it from TopSailor and save your configurations for quick re-use.
The data strip allows you to visualize the situation at any time and to make a quick decision on the instruction to send to the autopilot.
The autopilot page is available with GyroPilot2, Gyropilot 3 and HR Pilot.
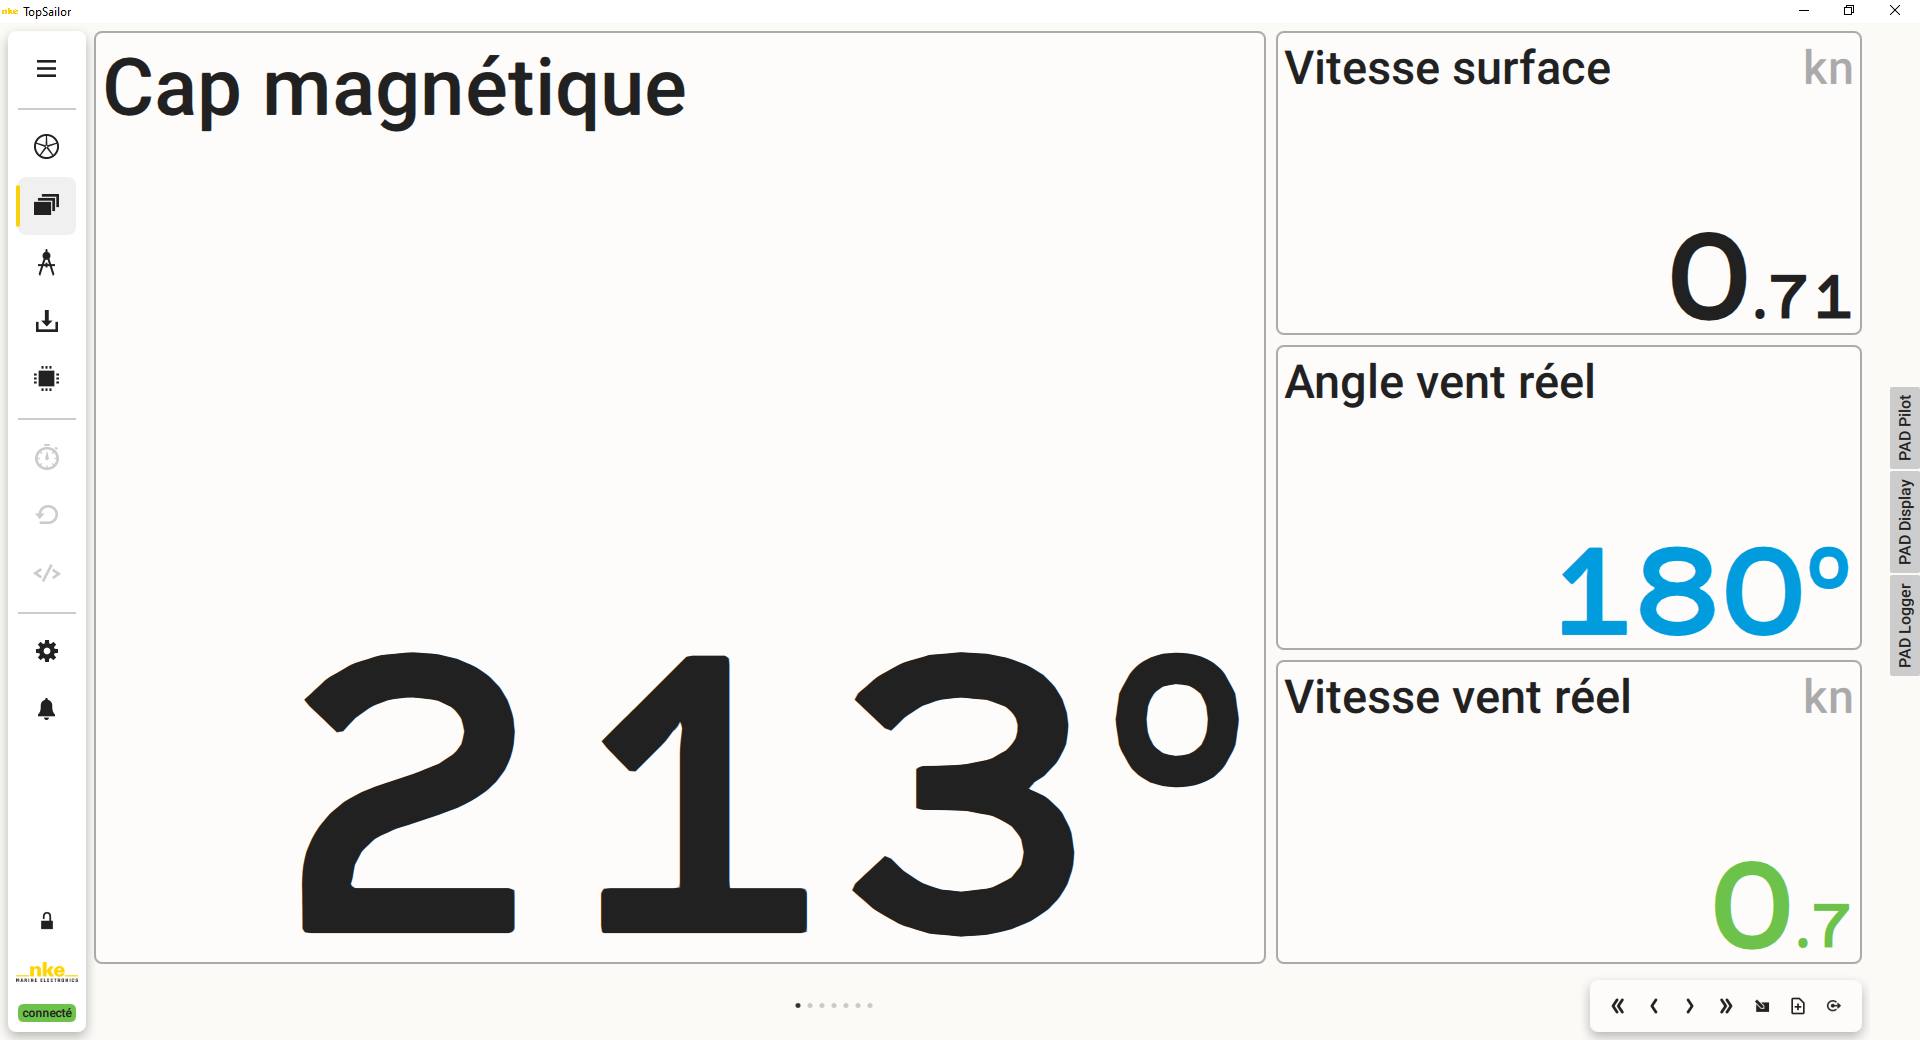
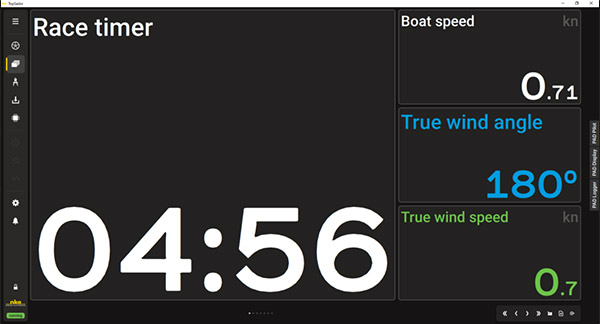
Save your data pages
Like a nke display, create pages to visualize your data as you want to. The different layouts will allow you to customize your screens to highlight the data that could help you to make the right decision at the right time.
Diagnose your instruments
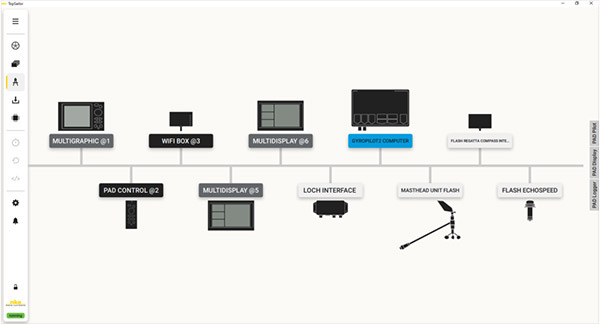
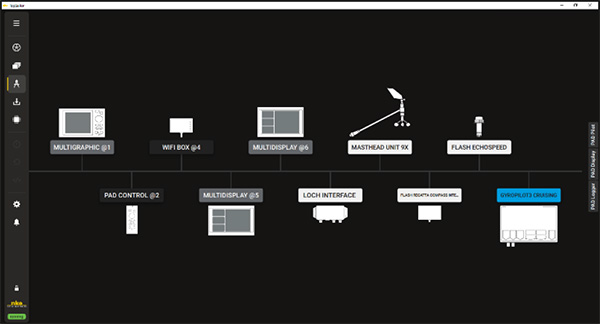
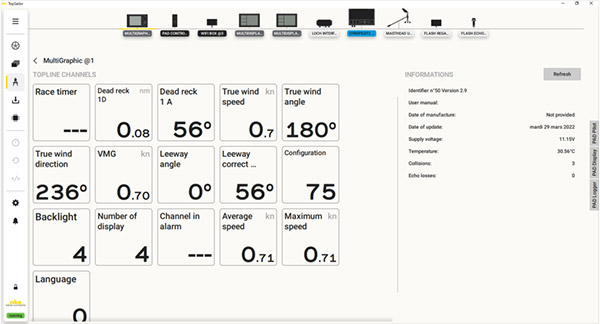
Find the instruments available on your bus. Identify them easily by their design and address.
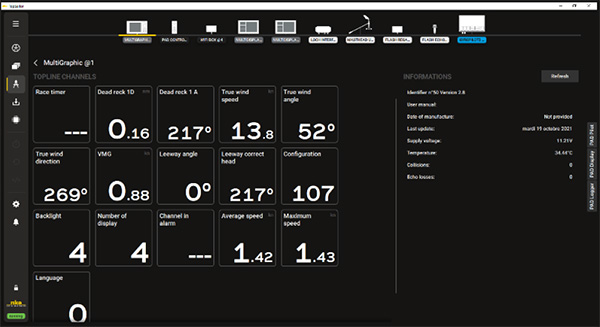
A diagnostic page is associated with each device and allows you to quickly find out its status, if there are any errors or lost information. You will also find the user manual for the product to learn how to use them in the best conditions.
The Topline channels associated with each instrument will show you where the data come from. They will also allow you to determine if an NMEA input is configured on a compatible device.
Save your data
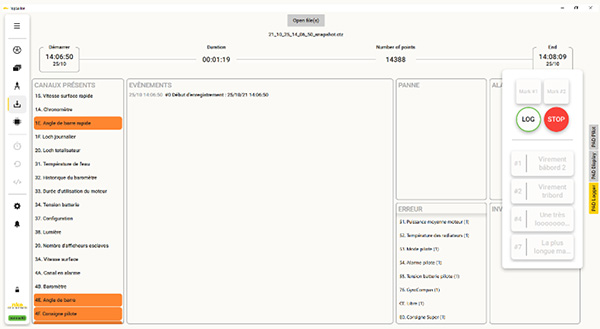
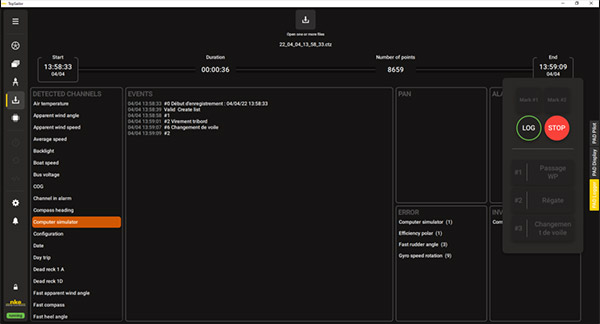
The Logger module allows you to record the data flow on the Topline bus. It is first of all a diagnostic tool that will eventually allow you to analyze your outputs more precisely.

